Get In-Depth Data to Fuel Your Strategy
All 30 MLS clubs have a front-of-jersey partner. The league reached full sellout with an average deal at $5.1M — making MLS showcasing how important to brands the jersey markets in North American sports can be.
However, after the 2026 All-Star Break, changes are planned — but not for the jersey front patch. MLS is unlocking a new asset: back-of-jersey patch sponsorships. For brands that missed the front, or brands looking for a more efficient entry into the world's fastest-growing soccer league, this is the window.
For brands that want large real estate on a jersey in the MLS, the back is now the only available path. And at a entry of $600K — $5.1M on the front.
SponsorUnited has mapped estimated market pricing for jersey back patch pricing across all 30 MLS clubs, tiered by brand equity, market size, and commercial activity. The range: $600K to $4.1M — a 75%+ discount to the front patch average, with nearly equivalent visual real estate on the jersey.
A New Asset — and Why the Timing Matters
MLS first allowed front-of-kit ads in 2007. Sleeve patches followed in 2020. The back-of-kit is the league's fourth commercial placement — and it arrives at arguably the most important moment in MLS history.
The 2026 FIFA World Cup is co-hosted across North America. Every major market MLS operates in will be a World Cup host city. Viewership, brand investment, and soccer's cultural relevance in the U.S. are all accelerating. MLS's chief revenue officer Carter Ladd put it directly:
"We feel like this is the right moment in time to unlock a new asset for our clubs to capture the attention coming out of the World Cup. The next era for our league is on the horizon."
— Carter Ladd, Chief Revenue Officer, MLS
The Asset: What Brands Are Actually Buying
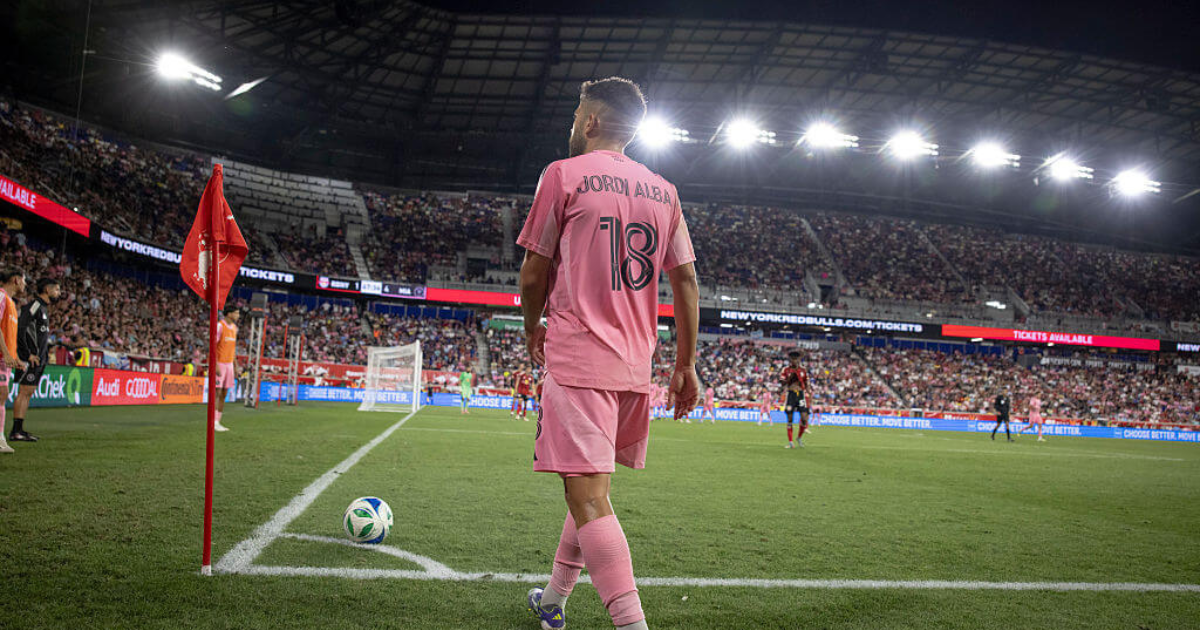
The back-of-kit placement sits below the player's number. The permitted dimensions — up to 9 inches wide by 4 inches tall — make it approximately 80% the size of the front-of-jersey patch. It is significantly larger than the existing sleeve patches, which max out at 2.5 square inches.
In soccer broadcasts, the back of the jersey is consistently in frame. The wide-angle camera that covers the majority of match footage captures players facing away from goal, receiving passes, and pressing — putting the back of the kit in direct line-of-sight for viewers throughout the broadcast.
For brand visibility purposes, the asset is not a secondary placement. It is premium real estate at a more accessible price, at least so far.
Estimated Pricing Tiers: MLS Back of Jersey
Using SponsorUnited SPND platform data, we've segmented all 30 MLS clubs into five pricing tiers based on brand equity, market size, and commercial activity. Tiers 1 and 2 are shown below. Full club-level data, comparable deal benchmarks, and category exclusivity insights are available on the platform.
For Brands: What the Tiers Mean Strategically
Tier 1 and 2 clubs represent national-scale partnerships — markets like Miami and Los Angeles with outsized media footprints and fan bases that extend well beyond city limits. These are brand-building plays with visibility benchmarks comparable to mid-tier front patch deals in other leagues.
Tier 3 through 5 clubs offer efficient market access, strong regional activation and loyal fan bases, given the asset's novelty. For brands entering soccer sponsorship for the first time, this is the most cost-effective entry in the league.
All 30 back-of-jersey positions go live post-All Star Break. First movers set the pricing anchor. Brands that moved early on MLS front patches captured the most favorable terms. The same dynamic is now available on the back.
Access the Full Data on SponsorUnited
The complete MLS back-of-kit pricing breakdown — all 30 clubs, all 5 tiers — plus front patch estimated pricing, sleeve and kit sponsor spend, and category-level activity across the league is available on the SponsorUnited platform.
Explore MLS back-of-kit data on the SponsorUnited platform → sponsorunited.com
SponsorUnited tracks sponsorship activity across 900+ properties and 80,000+ brands. All pricing figures represent SponsorUnited platform estimates based on market analysis.
© SponsorUnited · Data reflects SponsorUnited SPND platform estimates as of 2025–26 season.
.png)
.png)
%20(1).png)

.png)
.png)
.png)
.png)
.png)
.png)
.png)
.png)

.png)
.png)


.png)


.png)

.png)


.png)