.png)
Get In-Depth Data to Fuel Your Strategy
A packed ballpark gives brands access to thousands of fans, but attendance is only one part of a team’s sponsorship revenue. Two MLB teams can draw similarly sized crowds yet generate very different amounts of sponsorship revenue. That gap can reveal how effectively each team is turning its audience, market presence and sponsorship assets into revenue.
To understand how those differences play out across Major League Baseball, SponsorUnited compared each team’s annual sponsorship revenue with its 2026 regular-season home attendance. The result is a sponsorship revenue-per-attendee metric: the amount of sponsorship revenue a team generates for every person who attends a home game over the course of the season. It provides a way to compare teams of different sizes and see where sponsorship revenue outpaces—or falls behind—the size of the in-stadium audience.
Across MLB, teams generated an average of $29.61 in sponsorship revenue per attendee, with a median of $26.39. But the differences between teams were substantial. The top eight teams averaged $40.77 per attendee, compared with $17.04 for the bottom eight—a nearly 2.4× gap.
Which teams generate the most sponsorship revenue relative to their attendance, and what can that tell brand marketers about the opportunities available across MLB?
To explore the difference, SponsorUnited compared each MLB team’s annual sponsorship revenue with its 2026 regular-season home attendance. Across the league, teams generated an average of $29.61 in sponsorship revenue per attendee. The median was $26.39 per attendee.
The range was much wider. The top eight teams averaged $40.77 per attendee, compared with $17.04 for the bottom eight—a nearly 2.4× difference.
The five highest figures were:
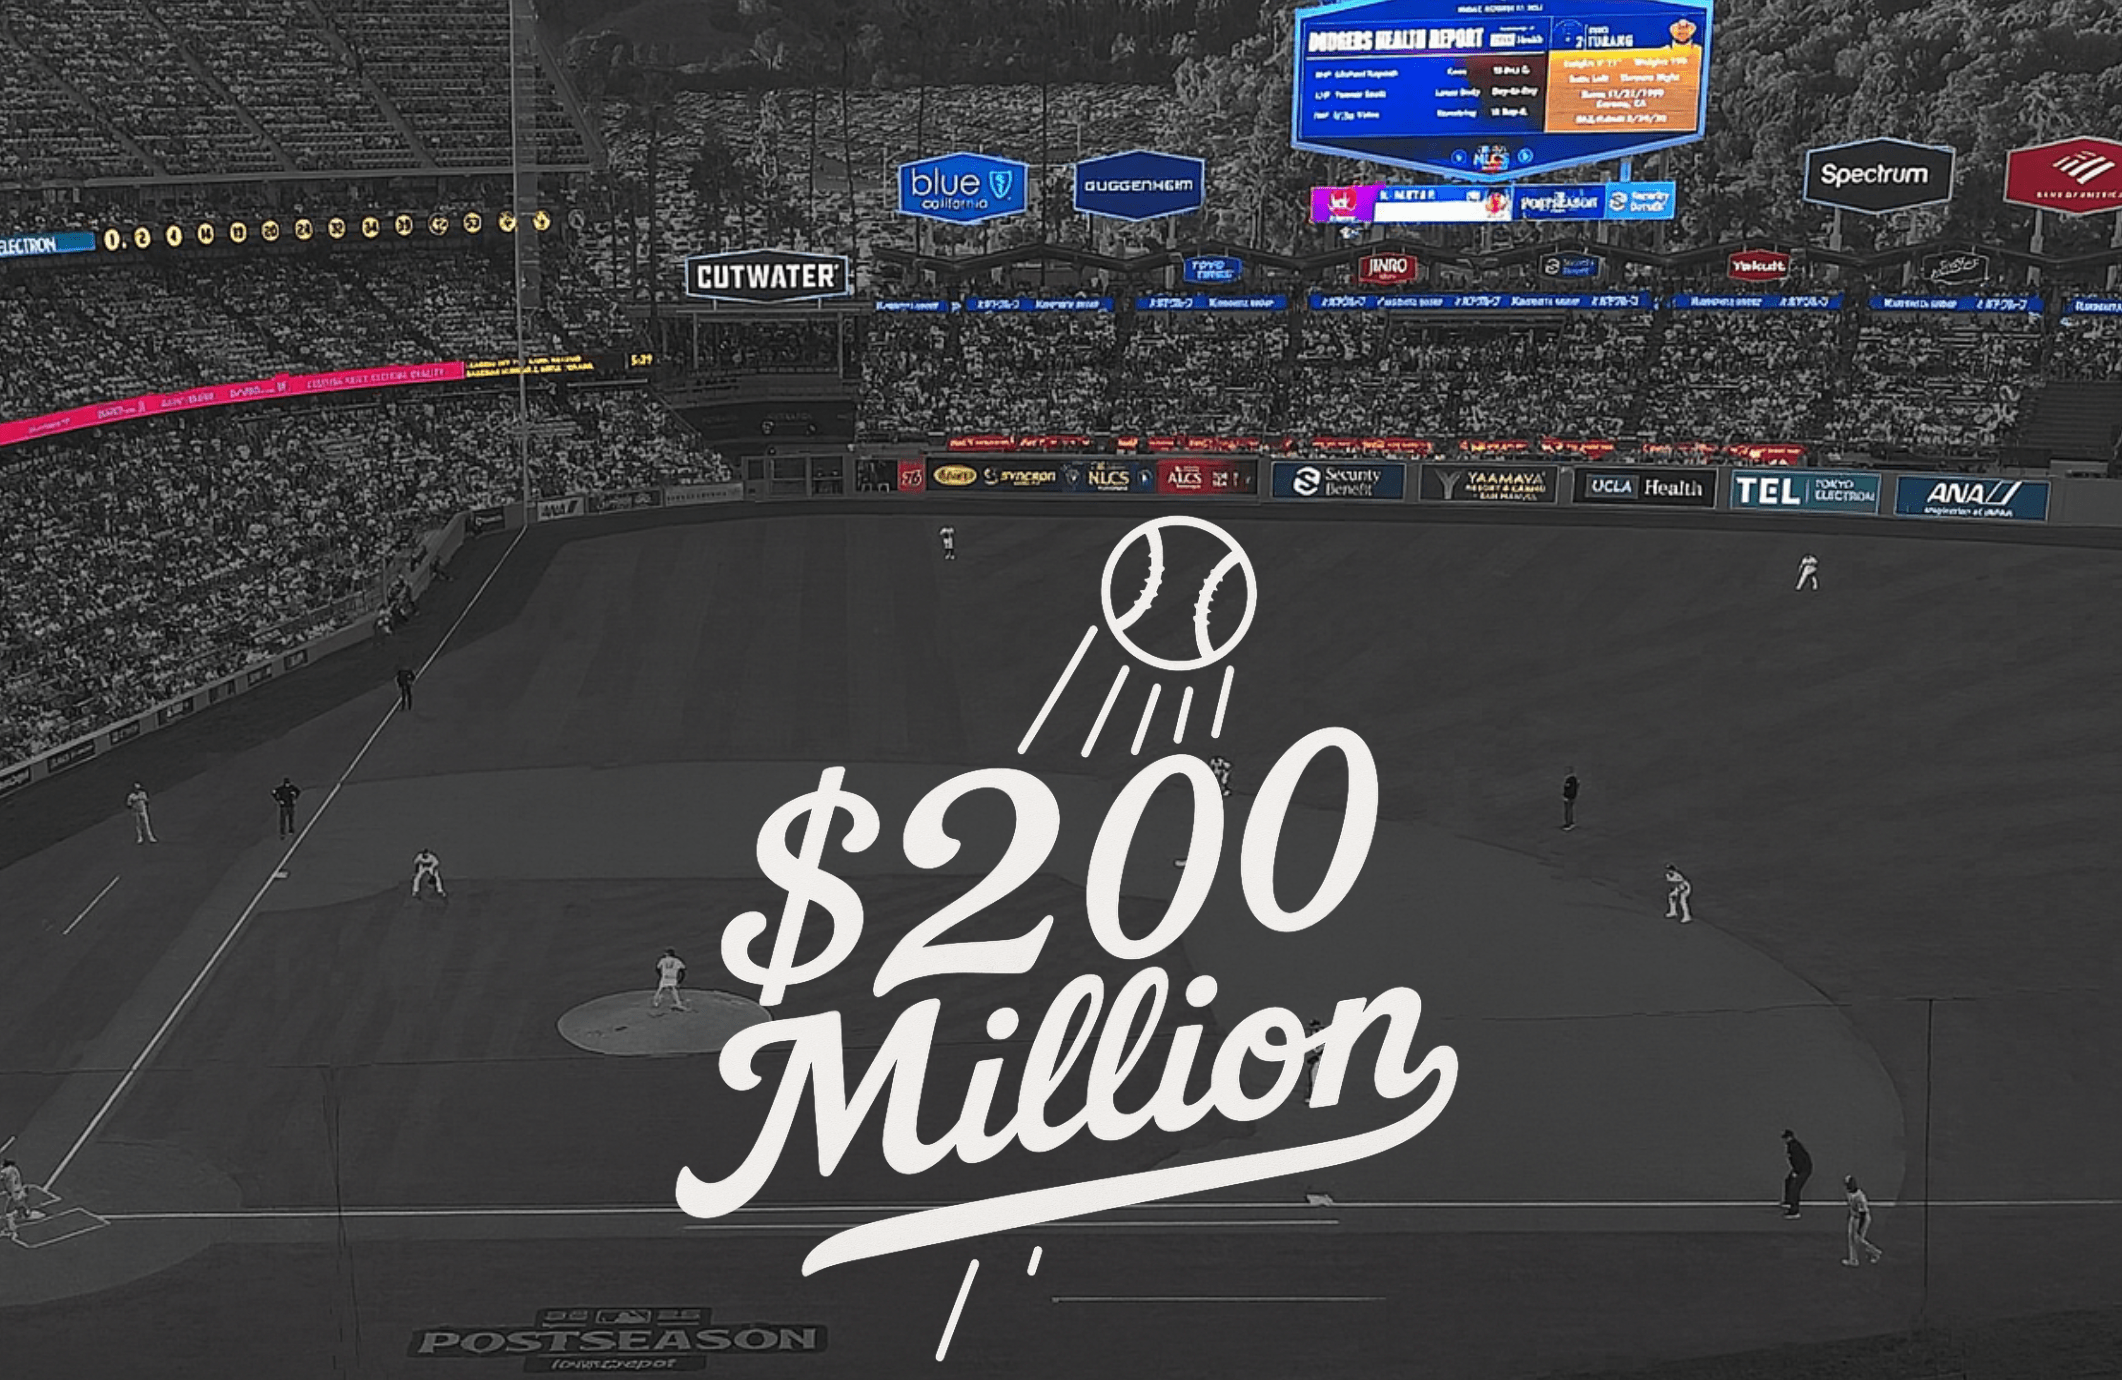
- Los Angeles Dodgers: $56 per attendee
- Boston Red Sox: $43
- Atlanta Braves: $41
- Houston Astros: $40
- New York Yankees: $38
For brand marketers, the gap raises a useful question: What does a team offer beyond the fans who attend its games?
A sponsorship can extend across broadcasts, digital channels, community programs, premium experiences, player connections and a team’s presence in its market. Those assets differ by club, as do market size, inventory, and star power. A team with a higher revenue-per-attendee figure may have more ways to package its reach, greater demand for its rights, or both.
That makes the metric a starting point for evaluating an opportunity, not a price guide. It does not measure what an individual fan is worth to a sponsor, and it cannot show whether a particular deal performed well. It does, however, put teams of different attendance sizes on a common scale and reveal where sponsorship revenue diverges from the size of the in-stadium audience.
The next step for brands is to look inside that difference. Which audiences can the partnership reach beyond game day or outside the stadium? Which rights help the brand meet its objective? And what can the team execute that another property cannot?
Attendance tells you how many fans came through the gates. A strong sponsorship evaluation asks what a team can help a brand do with that relationship.
Methodology: SponsorUnited 2026 MLB team sponsorship revenue divided by 2026 regular-season home attendance figures reported by Sports Business Journal. Figures are rounded. This ratio compares team revenue with attendance; it does not attribute sponsorship revenue directly to individual attendees.
.png)
.png)
.png)
.png)
.png)
%20(2).png)
.png)
.png)
.png)
.png)
.png)
.png)
%20(1).png)
.png)
.png)
.png)
.png)
.png)


.png)
.png)
%20(1).png)



.png)
.png)
.png)
.png)
.png)
.png)
.png)
.png)

.png)
.png)







.png)





























.jpg)