.jpg)
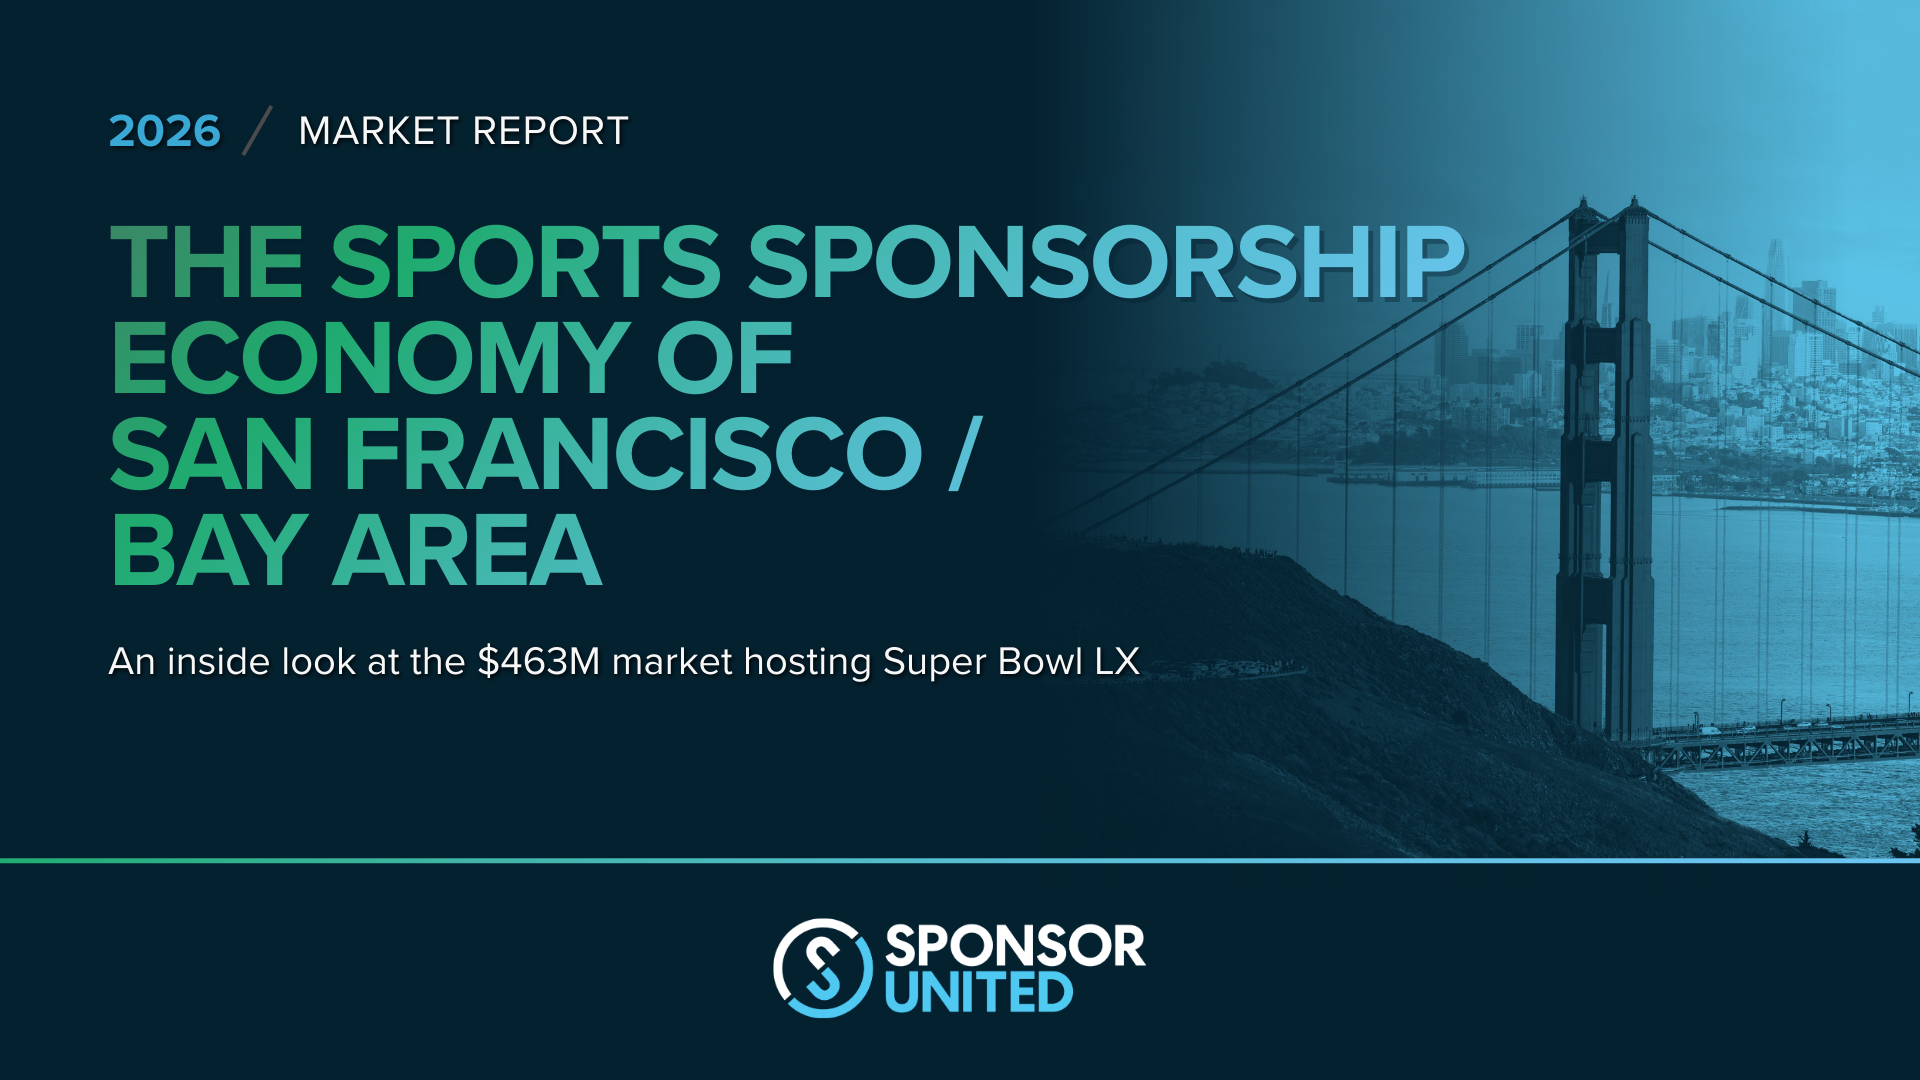
The Bay Area market combines the San Francisco, Oakland, San Jose, Berkeley, and Stanford regions. This aggregate region commands a total sponsorship spend of $463 million with an average deal size of $770K. Major brands are deeply embedded in the Bay Area’s sponsorship landscape: top spenders Rakuten, Chase, and Kaiser Permanente lead the way, new entrants such as NetApp have infused fresh investment, and iconic local partner Levi’s continues to play a prominent role. Technology is the dominant sponsorship category at $121 million, while sectors like Materials, Real Estate, and Home Furnishings remain underrepresented – highlighting a prime opportunity for brand marketers to tap into this high-value, diverse team ecosystem.
Methodology:
This report offers an in-depth analysis of brand sponsorships across the San Francisco/Bay Area market, encompassing San Francisco, Oakland, San Jose, Berkeley, and Stanford regions. The analysis covers the most recently completed seasons across multiple professional and collegiate leagues, including 422 unique brands and 590 sponsorship deals.
The report includes sponsorship data from the following leagues and seasons:
- Professional: NFL (2025-26), NBA (2024-25), NHL (2024-25), MLB (2025), MLS (2025), WNBA (2025), NWSL (2025)
- Collegiate: NCAA Power 4 conferences (2024-25)
In addition to traditional sponsorship deals, the total number of team deals could also include individual brands that are part of a parent company portfolio; deals signed at the league level (but that include team signage); and/or sponsorship deals signed through third-party agencies. In cases where a parent company secures a sponsorship deal and provides exposure for multiple sub-brands, the exposure of each sub-brand is counted as a separate, individual deal.
Sponsorship pricing data is from SponsorUnited's recently launched SPND product and reflects the most recently completed season for the league. SponsorUnited’s SPND product estimates sponsorship deal pricing using a proprietary algorithm, which combines AI technology with multiple data sources, continually refining estimates based on new inputs. The SponsorUnited model integrates all platform-tracked marketing assets, rights holder characteristics, market and category trends, and over $13.3 billion in actual sponsorship deal transactions.
The 2026 Sports Sponsorship Economy of San Francisco / Bay Area Report was jointly authored by SponsorUnited's Marketing, Business Intelligence, and Analytics teams, using data from August 1, 2025 to February 9, 2026. Data for this report was sourced from the SponsorUnited SaaS platform, which tracks and analyzes sponsorship activity across all professional and collegiate leagues, its teams, and its athletes.

%20(1).png)
.png)
.png)
%20(1).png)

.png)
.png)
.jpg)
.jpg)


.png)


.jpeg)

.png)


.png)

.png)


_page-0001.jpg)